 hood-price.isbscience.org/research/patterns-of-spatial-expression-in-the-mouse-brain/
Spatial expression patterns of neuron-specific genes in the adult mouse brain show remarkably clear, spatially-contiguous, transcriptionally-distinct clusters. Over the past year, we have been quantifying the relationships between these spatial expression patterns and known brain regions. To do this, we are taking advantage of a newly released API from the Allen Institute that makes available for the first time three-dimensional grids for the expression of 20,000 genes in 200um^3 voxels of the adult mouse brain, registered to a common reference atlas with annotations to fine-scale brain structures. We downloaded the grid-level expression data, performed clustering of the new dataset, and are developing algorithms to quantify clustering relative to brain regions, for neuron-specific genes and for thousands of randomly generated gene sets. We have found that the combined spatial expression patterns of 170 neuron-specific transcripts revealed strikingly clear and symmetrical signatures for most of the brain’s major subdivisions in the mouse brain.
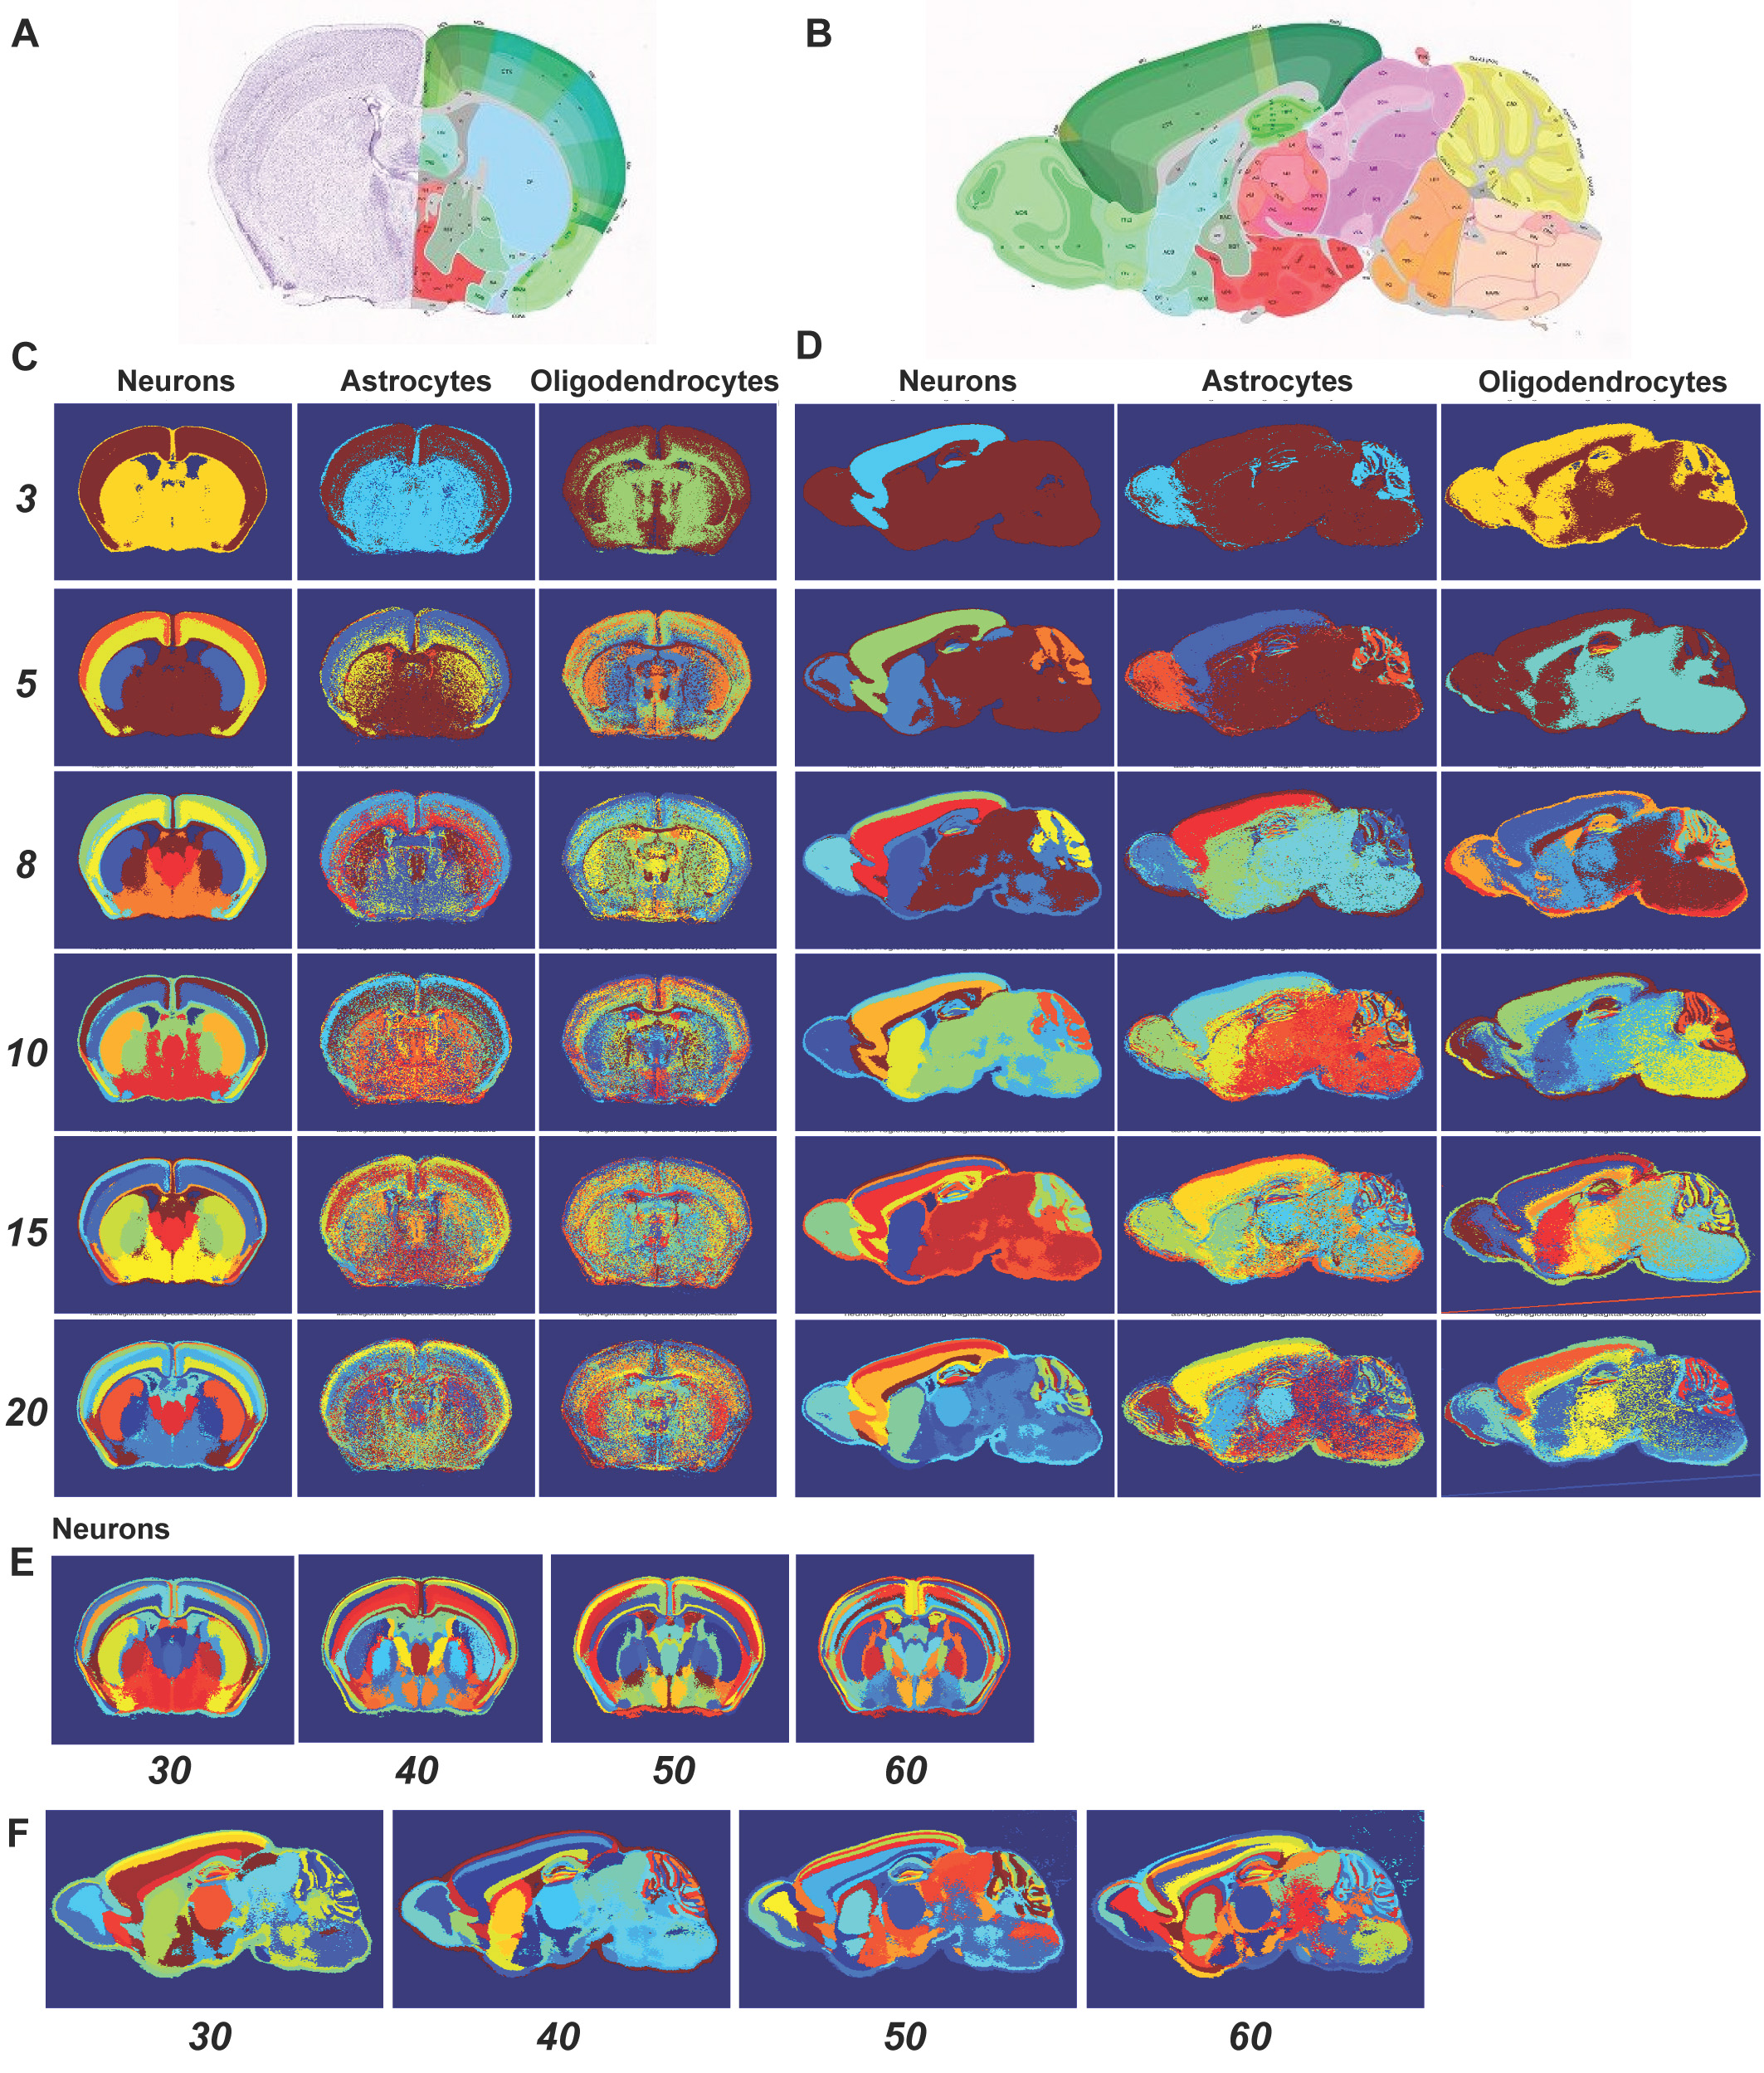
Transcriptionally distinct, spatially contiguous regions in the adult mouse brain revealed by clustering of neuron-, astrocyte-, and oligodendrocyte-specific genes. Expression data were assembled for sections through the center of the mouse brain. A, B. Atlases for regions visible on the coronal (A) and sagittal (B) planes. C. k-means clusters derived from the expression of neuron-, astrocyte-, or oligodendrocyte-specific genes on the coronal plane (k = 3-20). D. K-means clustering based on the expression of these genes on the sagittal plane. E, F. Clustering of neuron-specific genes for larger numbers of clusters (k = 30-60), using expression on the coronal (E) and sagittal (F) planes, respectively.
Moreover, the brain expression spatial signatures correspond to anatomical structures, possibly reflecting developmental ontogeny. Spatial expression profiles of astrocyte- and oligodendrocyte-specific genes also revealed regional differences that are less distinct, but still symmetrical. The regional differences revealed by neuron-specific genes related to individual genes with highly restricted expression patterns, functionally-related groups of genes with enriched or depleted expression across brain regions, and regional differences in neuronal cell density. Products from some of these neuron-specific genes are present in peripheral blood, raising the possibility that they could collectively function as biomarkers for clinical disease diagnostics.
For more information, see: Ko, Y., Ament, S.A., Eddy, J.A., Caballero, J., Earls, J.C., Hood, L., Price, N.D., 2013. Cell type-specific genes show striking and distinct patterns of spatial expression in the mouse brain. Proc Natl Acad Sci U S A 110, 3095–3100. (doi)